The eBPF -3 uprobes
A gentle introduction to userspace instrumentation
Before we start, I want to highlight the difference between bpftrace and eBPF programs.
eBPF Programs: eBPF programs are a bit more complex and require writing two separate sections of code - one for userspace, and one for kernel space. These programs are not limited to tracing, and can be used for any number of tasks ranging from performance enhancing to deep security.
bpftrace : It is focused solely on tracing and abstracts away a lot of the complexity, allowing us to get started instrumenting and tracing right out of the box with an easy scripting language.
Alright - now that we have that out of the way, let's look at some userspace instrumentation. We'll cover uprobe and uretprobe. These allow us to instrument the beginning and end(return) of a user-level function execution respectively. i.e uprobe will instrument the beginning, and uretprobe - as the name suggests - will instrument the end.
What is instrumentation and why would we want to instrument?
In this blog series, I will intentionally digress from the core subject to provide the reader with a broader understanding. Instrumentation refers to the process of adding monitoring and measuring capabilities to a program. Think of it like a debugger, but instead of something like gdb which pauses the execution of a program to allow an engineer to debug/change anything in the process flow, uprobe based instrumentation happens purely in runtime - execution is not paused. In the context of a uprobe, when the specified instruction is called (the start of the function) the probe temporarily redirects execution to a specified handler (in this case the eBPF program). We can then collect data from the system at this point, modify the process state, or even change the instruction entirely. As discussed earlier, using bpftrace will limit us to tracing and reading the system state at these points. Instrumenting code in this way adds a performance cost. Let's move on.
Optional Reading : To dive deep into uprobe tracing read - https://docs.kernel.org/trace/uprobetracer.html
Finding functions to instrument
You can use objdump or nm to find functions to instrument. objdump is a tool to display information about object files. An object file is a file containing object code, that is - the result of compiling source code. It includes machine code (instructions that the processor can execute), data sections, symbols, and other metadata depending on how it was compiled. Object files are usually an intermediate step while building a full program. A linker takes one or more object files and combines them to produce a final executable or a library.
└──╼ $objdump -tT /bin/bash | grep readline
0000000000137960 g    DO .bss    0000000000000008  Base        rl_readline_state
00000000000bfb50 g    DF .text    0000000000000312  Base        readline_internal_char
00000000000bef90 g    DF .text    0000000000000157  Base        readline_internal_setup
000000000008c6e0 g    DF .text    000000000000009c  Base        posix_readline_initialize
00000000000c0530 g    DF .text    000000000000009a  Base        readline
0000000000135cd4 g    DO .bss    0000000000000004  Base        bash_readline_initialized
000000000012da50 g    DO .data    0000000000000008  Base        rl_readline_name
0000000000128930 g    DO .data    0000000000000004  Base        rl_readline_version
000000000008c9b0 g    DF .text    000000000000084b  Base        initialize_readline
000000000012e018 g    DO .bss    0000000000000004  Base        current_readline_line_index
000000000012e028 g    DO .bss    0000000000000008  Base        current_readline_prompt
00000000000954f0 g    DF .text    0000000000000041  Base        pcomp_set_readline_variables
000000000012e020 g    DO .bss    0000000000000008  Base        current_readline_line
00000000000bf0f0 g    DF .text    0000000000000120  Base        readline_internal_teardown
000000000012892c g    DO .data    0000000000000004  Base        rl_gnu_readline_p
-t will print the symbol table entries of the file
-T will print the dynamic symbol table entries of the file. This is only meaningful in a case where shared / dynamically linked libraries have been used.
g means Global - meaning that it's a global symbol accessible from other object files
DO - Data Object - a symbol in the data section
DF - Data Function - A function in the text (code) section
To know more about sections etc, please read about object files and assembly. It's good to know as much as you can.
Let's hook the start and endpoints of the readline function in bash.
┌─[root@darkmatter]─[~]
└──╼ #bpftrace -e 'uprobe:/bin/bash:readline { printf("arg0: %s\n", str(arg0)); }'
Attaching 1 probe...
arg0: ┌─[apocalypse0@darkma
arg0: ┌─[apocalypse0@darkma
arg0: ┌─[apocalypse0@darkma
arg0: ┌─[apocalypse0@darkma
If you run the above command, open another terminal window and type some commands you'll keep seeing your prompt. The above output leads us to believe that the arg0 of the readline() function, when called from bash, is indeed my prompt. Let's confirm it by running man 3 readline
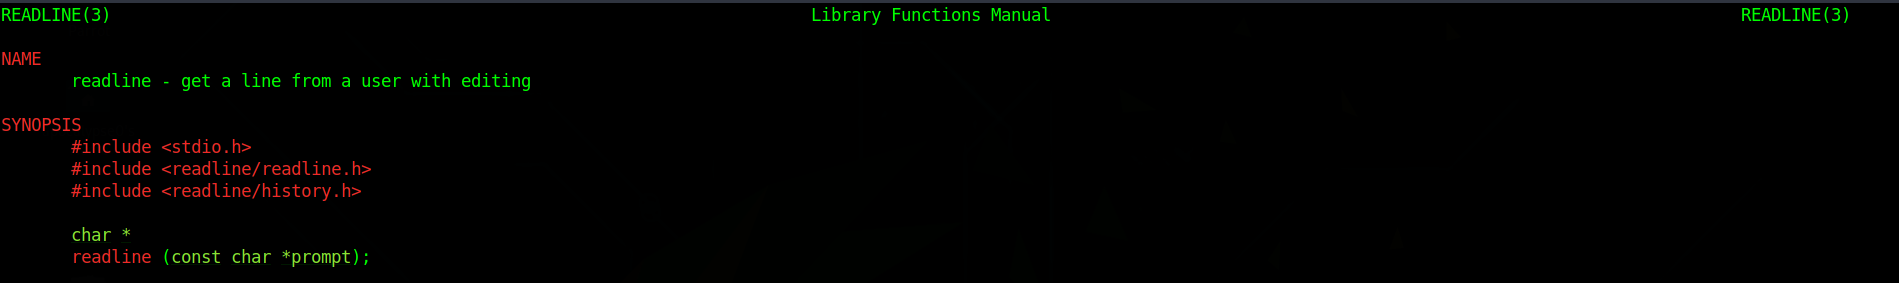
So readline will take in 1 argument - that is the prompt, and that is indeed what it's returning. I have no idea why it's truncated, and I will not be pursuing that. On some of my systems it is truncated, on others it is not.
Now to get the return value. The same man page, further down states
"RETURN VALUE readline returns the text of the line read. A blank line returns the empty string. If EOF is encountered while reading a line, and the line is empty, NULL is returned. If an EOF is read with a non-empty line, it is treated as a newline."
Let's try and get that
┌─[✗]─[root@darkmatter]─[~]
└──╼ #bpftrace -e 'uretprobe:/bin/bash:readline { printf("readline: \"%s\"\n", str(retval)); }'
Attaching 1 probe...
readline: "clear"
readline: "ls"
readline: "top"
readline: "id"
readline: "whoami"
readline: "who"
readline: "last"
According to the docs at https://github.com/iovisor/bpftrace/blob/master/docs/reference_guide.md#3-uprobeuretprobe-dynamic-tracing-user-level, the arguments can be accessed as follows
uprobe: arg0, arg1, ..., argN
uretprobe: retval
We can get the prompt and the command as follows
┌─[root@parrot]─[/home/apocalypse0/Documents/BPF]
└──_ #cat bpftrace_bash.bt
uprobe:/bin/bash:readline { printf("%s: ", str(arg0)); }
uretprobe:/bin/bash:readline { printf("%s\n ", str(retval)); }
┌─[root@parrot]─[/home/apocalypse0/Documents/BPF]
└──_ #bpftrace bpftrace_bash.bt
Attaching 2 probes...
┌─[apocalypse0@parrot: id
 ┌─[apocalypse0@parrot: whoami
Filters
Now let's write our first filter. Since we are now looking at bash, and instrumenting the readline to get the prompt, as well as the command entered, how about we attempt to get the stdout?
One way to do this is to trace the write() syscall. We know that stdout is represented by the file descriptor. Let's take a look at a couple of things. The first is the man 2 write page.
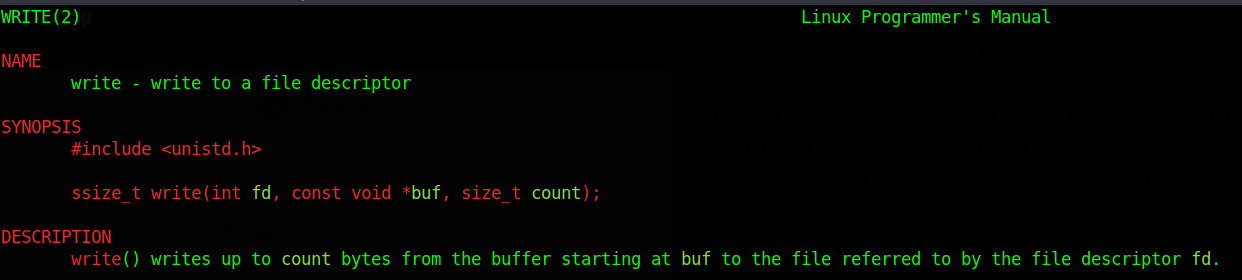
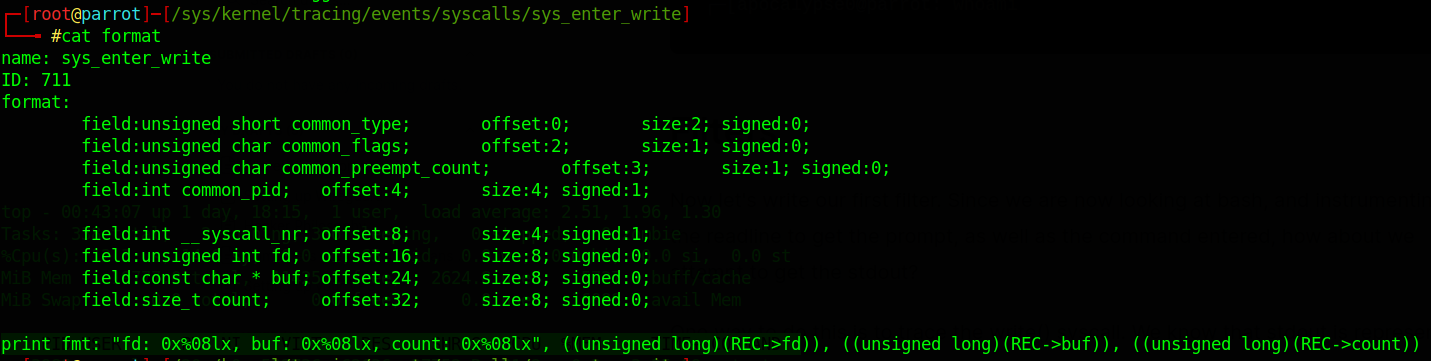
The second thing we can look at is the kernel tracing format file for the entry of the write() syscall. By now you should be familiar with all of this so I will not be explaining things in too much detail, and the screenshots alone should suffice.
Let us attempt to write our first filter:
Syntax: /filter/
Filters (also known as predicates) can be added after probe names. The probe still fires, but it will skip the action unless the filter is true.
┌─[root@parrot]─[/sys/kernel/tracing/events/syscalls/sys_enter_write]
└──╼ #bpftrace -e 't:syscalls:sys_enter_write /args->fd == 1/ { printf("%s\n", str(args->buf)); }'
In the above example, we are attaching a tracepoint at the entry of the write() syscall. As indicated in the screenshot above, the format of this includes some of the variables available to us - which are:
fd : File descriptor
buf : What is being written
Since these are pointers, we need to dereference them before we print them. In the filter section, we specify that only if the file descriptor is equal to 1, the action should be performed. That is, we only want to print the stdout. Beware : depending on what your system is doing, this output could be incredibly noisy. It's an interesting way to take a sneak peek under the hood and see what's happening inside the system - it's like spying on all the programs in your computer! If your system is doing pretty much nothing, fire up another terminal window and run a few commands - you should see the output of those commands.
Try out different combinations of this - try and combine knowledge from the previous lessons with this to write some programs, play about, break things, instrument things - and grow your understanding.
Conclusion
We learned about userspace instrumentation in this blog. It is a powerful feature. You could instrument routines in libc and intercept pretty much anything that you'd like - if you know what you want to look for.