
K
Hacker, creator, musician, martial artist, western classical guitar player, motorcyclist, performer, yoga practitioner.
Search for a command to run...
No comments yet. Be the first to comment.
How a few lines of missing documentation might have led to unauthorized access to thousands of apps using Firebase Auth and Neo4j's GraphQL library.

Occasionally, we folks using Linux find our selves in situations where things break; our computers do not function as intended. In my scenario, I was out on business in another country, and my WiFi device was simply not showing up after a reboot. I k...

Exploring possibilities with the power language models

Learning new things or building new things requires rapid prototyping. This is a guide on how to create a VM template using a raw image and LVM-Thin storage. We're using an ubuntu cloud image in this. get https://cloud-images.ubuntu.com/noble/current...
I had a weird notion that proxmox was throttling the network throughput of guests, however today I discovered that it was only due to the CPU of the guest machine. Here's the scenario. I have a 1GBPS connection to the internet. All machines in my off...
Welcome, this is the first in a series of articles that I will be writing about the eBPF - in my quest to educate myself, and (hopefully) other unfortunate souls who find the need to run code in kernel-space to go about their daily lives.
The eBPF is a powerful tool for programmers and security professionals. It allows you to peek under the hood of userspace and build powerful things. Knowledge of this domain will allow you to build powerful custom defensive architectures, scalable solutions and write good malware for offensive exercises.
In this first part, we are going to learn a little bit about the kernel, syscalls, processes and where to go to find information about all of this. Understanding systems at such a fundamental level will empower you to build anything, break anything, and essentially bend computers to your own will. As the demand for cybersecurity grows, the world needs security professionals who truly understand systems from the ground up.
I'll be using Ubuntu 22.04 clean install on a VirtualBox VM. Feel free to use whatever you like. Ubuntu makes it easy to install tools. Essentially you could use any Linux kernel with eBPF support. On Ubuntu, you'll need to install bpftrace to complete the exercises in this blog.
sudo apt install bpftrace
In this blog, we will be using bpftrace to write a couple of probes that allow us to monitor syscalls, and print information about them. Yes, there are easier ways to do this - such as the audit subsystem, however, this is an exercise in exploration, knowledge, security and personal growth. We will be taking the long route.
The link below will help when we want to understand arguments and parameters going forward. Don't worry to much about it now, just keep it handy. Don't even read it.
https://github.com/iovisor/bpftrace/blob/master/docs/reference_guide.md
Look inside /sys/kernel/debug/tracing/events/syscalls to get a list of syscalls. For the purpose of this blog, we will be looking at the execve.
root@darkmatterlab:/sys/kernel/debug/tracing/events/syscalls# ls -lah | grep execve
drwxr-x---   2 root root 0 Aug  9 13:50 sys_enter_execve
drwxr-x---   2 root root 0 Aug  9 13:50 sys_enter_execveat
drwxr-x---   2 root root 0 Aug  9 13:50 sys_exit_execve
drwxr-x---   2 root root 0 Aug  9 13:50 sys_exit_execveat
root@darkmatterlab:/sys/kernel/debug/tracing/events/syscalls#
We notice two calls here that are of interest to us.
sys_enter_execve and sys_exit_execve.
Now let's look inside the sys_enter_execve and take a look at the format.
root@darkmatterlab:/sys/kernel/debug/tracing/events/syscalls/sys_enter_execve# ls
enable  filter  format  hist  id  inject  trigger
root@darkmatterlab:/sys/kernel/debug/tracing/events/syscalls/sys_enter_execve# cat format
name: sys_enter_execve
ID: 716
format:
    field:unsigned short common_type;    offset:0;    size:2;    signed:0;
    field:unsigned char common_flags;    offset:2;    size:1;    signed:0;
    field:unsigned char common_preempt_count;    offset:3;    size:1;    signed:0;
    field:int common_pid;    offset:4;    size:4;    signed:1;

    field:int __syscall_nr;    offset:8;    size:4;    signed:1;
    field:const char * filename;    offset:16;    size:8;    signed:0;
    field:const char *const * argv;    offset:24;    size:8;    signed:0;
    field:const char *const * envp;    offset:32;    size:8;    signed:0;

print fmt: "filename: 0x%08lx, argv: 0x%08lx, envp: 0x%08lx", ((unsigned long)(REC->filename)), ((unsigned long)(REC->argv)), ((unsigned long)(REC->envp))
root@darkmatterlab:/sys/kernel/debug/tracing/events/syscalls/sys_enter_execve#
Looking at the above, you can gauge the format and parameters of sys_enter_execve If this seems confusing to you still - hang on, you'll be better off in a couple of steps.
Run man bpftrace to understand the flags of the command. We'll be using the 'e' flag which let's us run a program right after the flag. The syntax of this program is the C Language.
Let's write a one-liner to trace all syscalls of type - sys_enter_execve
root@darkmatterlab:/# bpftrace -e 't:syscalls:sys_enter_execve { printf("pid: %d -- comm:%s\n", pid,comm); }'
Attaching 1 probe...
We're using bpftrace to run a program to call a tracepoint ('t) for syscalls - specifically the enter_execve. When we run this command, we can see that we are attaching 1 probe (we're tracing one syscall right now). The data that you can print here is listed in the 'format' document above. In addition to that, you can derive from the standard set of context data available when working with tracepoints. This contextual information isn't explicitly mentioned in the 'format' file for each tracepoint, but tracing tools have access to it. 'comm', 'pid', 'tid' are examples of such fields. You can read more about the common variables from here - https://github.com/iovisor/bpftrace/blob/master/docs/reference_guide.md#1-builtins. In contrast to the builtin variables, the format file describes the layout of data specific to the 'enter_execve' syscall.
comm is the name of the current task or process, which typically corresponds to the name of the command that was used to start it. The comm field is the executables name without it's path and limited to 16 characters in length including the null terminator.
After running this above command, open another terminal and run any bash command - you will see similar output.
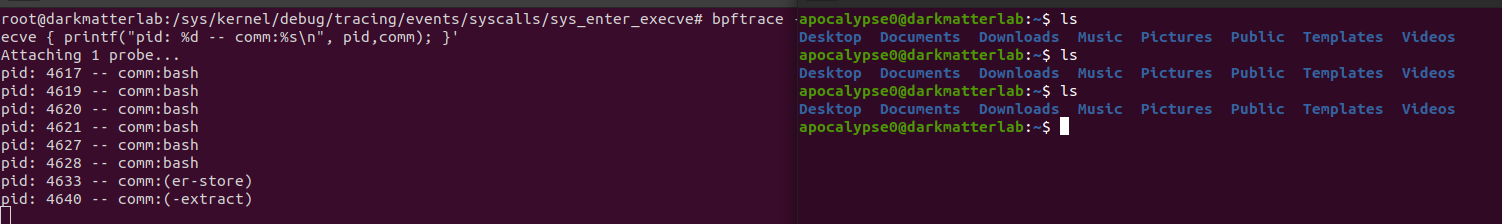
Awesome - you've just done your first trace!
Notice though - you only see bash as the comm for any command you run. Let's try and get the name of the actual command that you run. Referencing the 'format' file of this particular tracepoint, we see that 'filename' is a data attribute. You'll need to convert it to a string, else it will throw an exception.
root@darkmatterlab:~/bpftrace_learn# bpftrace -e 't:syscalls:sys_enter_execve { printf("pid: %d -- comm:%s -- %s\n", pid,comm, str(args->filename)); }'

Notice that now we can see the specific commands that were run.
Great - that's all for this article. I will be following it up soon with the next one, where we look at the exit syscall. We'll understand entries and exits, write some bpftrace scripts and try to get a glimpse under the hood.
The direction of this series is going to be exploratory - starting from basic concepts, and building up gradually to writing eBPF applications, and writing custom defensive code for your systems and applications. Hang tight and enjoy.
I hope you found this article informative. I am intentionally keeping the articles short, with achievable goals to lend a sense of achievement and minimise the frustration that comes with learning a new subject.
Credits : I've referenced Michael Mullin's tutorial videos on YouTube for a lot of my current understanding of this subject.